Showing posts with label Measuring Congestion. Show all posts

Sunday, December 04, 2011

How WA Fares in Congestion Report

The Texas Transportation Institute has just (November 2011) released its annual Congested Corridors Report

Unfortunately, Western Washington made almost all the Top 40 hits list!

The Congested Corridors Report (2010 data) includes an analysis of 328 specific (directional) freeway corridors in the U.S.  These corridors account for:
  • 6 % of national urban freeway lane-miles
  • 36% of urban freeway delay
  • 33% of urban freeway truck delay
Each directional, adjacent and upstream segment of roadway that was congested for four hours per week was included in the corridor.  The minimum corridor length was three miles.

The Report measures reliability (how much the problems change day to day), extra travel time, increased fuel consumption and congestion costs. 

The stated purpose of the study is to understand how, when and where congestion occurs – as a tool to understanding what can be done.  Their conclusion:  all the potential congestion-reducing strategies are needed:  capacity and productivity.

Here’s how Washington State ranked against the Top 40 congested highway corridors throughout the nation.

Reliably Unreliable
Unreliability is the most disturbing problem. A predictable transportation system is important to motorists and goods movers. Reliability describes the extra time you add to each trip to ensure you will be on time – when you simply can’t be late. The Federal Highway Administration has been moving towards a greater focus on performance management in its programs. 

Area         Corridor       Endpoints                 Length      Natl Rank
Tacoma     I-5 SB         Exit 128- Exit 120    7.9 mi.         # 40

Congestion Leaders
This category ranks corridors by the annual delay per mile.  Considered are annual gallons of waster fuel and the annual congestion costs associated with fuel and delay.

Area         Corridor       Endpoints                 Length      Natl Rank
Seattle       I-5 SB        Exit 175- Exit 165    8.9 mi.         # 33

Morning Peak
This category shows corridors with the largest delay per mile in the morning peak (6am to 10 am).  It uses the same measures as the Congestion Leaders category, but only measured during the morning peak.

Area         Corridor       Endpoints                 Length      Natl Rank
Seattle      I-5 NB         Exit 161- Exit 164    4.1 mi.         # 35

Afternoon Peak
This is the category for the worst afternoon peaks (3 pm to 7 pm).  Again, it uses the same measures as the Congestion Leaders category, but only for the afternoon hours.

Area         Corridor       Endpoints                 Length      Natl Rank
Seattle       I-405 SB    Exit 14- Exit 10        4.5 mi.         # 21

Lunch Breaks
This is the midday hours congestion category, for the 10 am to 3pm time period.  Again, it uses the same measures at the Congestion Leaders category, but only for this midday time.

Area         Corridor       Endpoints                 Length      Natl Rank
Seattle      I-5 NB         Exit 161- Exit 164    4.1 mi.         # 19

Area         Corridor       Endpoints                 Length      Natl Rank
Seattle       I-5 SB        Exit 175- Exit 165    9.0 mi.         # 22
  
Weekend
This is the rarest category, as weekend congestion is rarely a stop-and-go situation on Saturdays and Sundays.  It’s usually occurring at major shopping areas, sporting venues and other recreational activity centers.   Like before, the measures are the same as for Congestion Leaders, but based on traffic during the weekends.

Area         Corridor       Endpoints                 Length      Natl Rank
Tacoma     I-5 NB        Exit 129- Exit 133    4.2 mi.         # 11

Area         Corridor       Endpoints                 Length      Natl Rank
Seattle       I-5 NB        Exit 161- Exit 164    4.1 mi.         # 29

Trucking
This category includes the amount of daily truck travel on each corridor. While it uses the same measures as the Congestion Leaders category, it is based entirely on truck travel. 

Area         Corridor       Endpoints                 Length      Natl Rank
Seattle       I-5 SB       Exit 175- Exit 165    9.0 mi.         # 37

One-Hit Wonders
Their (last and final) fanciful category includes urban areas that have only one or two corridors included in the Congested Leaders category.  Unfortunately, our area did not make this list.


Tuesday, July 26, 2011

Avoid Gridlock - Build 167!

Kell McAboy, Planner, Port of Tacoma, briefed the Chamber's Port-Industrial Committee members about the Tacoma Area Transportation Study Final Report.

McAboy noted the SR 167 project was a baseline condition that must be done. Without it, the 2030 planning horizon forecast transportation gridlock. The current cost of SR 167 is estimated at $1.9 billion.  Or, as one wag said, "Just a tunnel short of funding."

The TATS study was done to provide the documentation needed to address future transportation projects. The eight stakeholders* began meeting July 22 to consider prioritization and future action to be taken as a result of this study.

That PowerPoint and other info can be found at this weblink on the Port of Tacoma website.
  • Washington State Department of Transportation
  • Port of Tacoma
  • City of Fife
  • City of Tacoma
  • SSA Marine
  • Pierce County
  • Freight Mobility Strategic Investment Board
  • Marine View Ventures

Wednesday, July 06, 2011

TATS and Pierce Transit at RAMP Today

RAMP attendees were treated to three presentations at RAMP this morning.

For a follow-up on the Update in the service reductions of Pierce Transit by Jessyn Ferrell, Pierce Transit, please go here.

For a follow-up on the final Tideflats Area Transportation Study report and a PPT presentation by Kell McAboy, Planner, Port of Tacoma, go to the links in this sentence.

Attendees were also treated to a briefing by Larry Ehl, Transportation Issues Daily and Allison Camden, Federal Relations Manager,WSDOT on the hoped for federal transportation act. 
  • The House bill will have a focus on roads nd will have significant decreases for state budgets. The House bill is expected to create a 35% reduction from previous funding levels.  A Republican press conference is scheduled for tomorrow.
  • The Senate's bi-partisan bill, limited to two years, will maintain current funding levels, but still would need $12 billion identified for funding.  Currently there is no proposal on how to make up that funding gap. 
 The next meeting for RAMP is September 7.

Wednesday, April 06, 2011

WA Truck Tracking Pilot Project

This morning, Barbara Ivanov, Co-director of WSDOT's Freight Systems Division, presented a briefing to the RAMP attendees about the Truck Tracking Pilot Project.

Begun by the Legislature in 2007, there is now two years of data in the central Puget Sound Region (King, Pierce, Snohomish, Kitsap) and nine months of data in the balance of the state.  The project uses GPS data from about 6,000 monitored trucks (1-2% of total truck traffic) to model the value statistics:  travel time.

Already, WSDOT is able to highlight a Top 10 Worst  highway stretches for central Puget Sound and the Top 10 Worst stretches for Washington state.  This info is promised for posting on DOT's website by the end of the contracted study period - June 2011.

Thursday, December 03, 2009

Puget Sound Traffic Getting Better, but Worst in Nation, Studies Find

Two reports released this week suggest that traffic congestion in the Puget Sound region is getting better, but it’s still the worst congestion in the country.

According to the Washington State Department of Transportation’s 2009 Annual Congestion Report (pdf, 1.7 mb ), in 2008 drivers in Washington state experienced (per capita) one hour less congestion compared to 2006. The report credits high gas prices, the economic downturn, and successful congestion fighting strategies with the decreases. While the news is good in the short-term, WSDOT predicts congestion will return as the economy improves. A summary of the findings is available on the WSDOT website.

Although congestion is down, that doesn’t mean commutes are good. A study by TomTom, a global positioning company found that Seattle has the worst traffic congestion of the 30 largest US cities, with 43 percent of the city’s roads having “heavy delays,” the Puget Sound Business Journal reports.. The company ranked cities as most to least congested according to how fast cars could travel on the street network. Traffic was defined as congested if drivers could travel at only 70 percent or less of the posted speed limit, and an average hour-long commute included 20 minutes or more of significant delays, according to TomTom.

Friday, November 07, 2008

Multi-Colored Thread Ties Community-Post

A quick look at the WSDOT traffic congestion map in the left column, for I-5 as it threads its way between Fort Lewis and the Lakewood-DuPont community often looks a remnant from Joseph's multi-colored coat.

However, it doesn't evoke envy.

At Wednesday's (11-05-08) regular meeting, RAMP looked at Lakewood's efforts to rescue this increasingly congested section of I-5 from the pit to which it has been cast. Melvin Austin, Chief of Base Security and Access Control shared with RAMP attendees the data on those going into the post. He was clear that his concerns were with security, not being a traffic engineer, but that he worked closely and cooperatively with WSDOT. And, he has similar concerns on post with the end-of-day exodus.

With the problem defined, Ellie Chambers-Grady and Dan Penrose, City of Lakewood, briefed RAMP attendees on the draft OEA (Office of Economic Adjustment)/Department of Defense grant they are preparing. (This grant application is the first of part of two components Lakewood is seeking, the second taking a comprehensive focus on community impacts from Ft. Lewis's growth.)


TRANSPORTATION PROPOSAL SCOPE


  1. Transportation alternatives analysis

  2. Operational traffic model
    assessment of current traffic conditions
    determine future transportation needs of the expected population increase
    determine short term and long term priorities within the study area
    identify resource needs and potential sources
    provide a coordinated action plan

  3. Project will be coordinated with the assistance of Washington State DOT

Friday, August 01, 2008

WSDOT Breaks Ground on First Segment of Crossbase Highway

On Wednesday, July 30, WSDOT broke ground on Project 1, the first segment of the overall SR 704, Cross Base Highway in Pierce County.

Transportation Secretary Paula Hammond, County Executive John Ladenburg and many others were on hand to celebrate this milestone.

Project 1 will be built for $7.35 million and connect Spanaway Loop Road to SR 7, drastically improving safety and mobility. A new dual right-turn lane from Spanaway Loop Road to southbound SR 7 will ease back-ups during peak travel times. The project is scheduled to wrap up in June 2009.

The remaining SR 704 projects will be completed as funding becomes available. The planned six-mile, multi-lane highway stretches east to west between Fort Lewis and McChord military bases, and connects SR 7 to I-5. The new corridor will provide congestion relief and reduced delays on I-5, SR 512, SR 7 and county roads.

Monday, April 14, 2008

Which Little Truck Went to Market How

WSDOT has just released the 2007 Update for the Freight and Goods Transportation System.

A common resource for local jurisdictions, the study examines the volume carried by routes with the state. Freight Corridors are defined as those routes that carry four million or more gross tons of freight annually (coded T-1 and T-2). Codes go from the T-1 of more than 10 million tons per year to T-5, of at least 20,000 tone in 60 days.

In 2007, a total of 2,607 state routes were designated as either T-1 or T-2, 37% of all state routes. T-1 routes accounted for 1,093 miles, 16% of all state routes. This update also provides info about county road and city street classifications.

The study does NOT provide info on the users of the route system, their economic performance, performance requirements, system needs and future trends. Other planning documents and reports expand this analysis and can be accessed through the WSDOT Freight Systems Division.

Friday, January 18, 2008

Commission Reports $225B Needed for Federal Highways

The National Surface Transportation Policy and Revenue Study Commission, created by Congress in 2005 under the Safe, Accountable, Flexible, Efficient Transportation Equity Act—A Legacy for Users (SAFETEA-LU), released its final report on Tuesday. The report suggests an annual investment of at least $225 billion for the next 50 years to upgrade to an advanced surface transportation system.

The bipartisan Commission's 12 members representing federal/state/local governments, metropolitan planning organizations, transportation-related industries, and associations has been tasked to examine not only the current condition and future needs of the nation's surface transportation system, but also to consider short and long-term alternatives to replace or supplement fuel tax as the principal revenue source for highway improvements.

At the heart of the Commission's recommendations is a plan to replace more than 100 current programs with 10 outcome-based initiatives with oversight from the U.S. Department of Transportation.

The Commission also recommends an array of new revenue sources, including:
  • An increase in the federal gas tax by 5-8 cents per gallon per year for a five-year period (25-40 cents total);
  • A vehicle miles traveled fee;
  • New tolls;
  • Peak-hour "congestion pricing" on federal-aid highways in major metropolitan areas;
  • A new freight fee for freight projects; and
  • Ticket taxes for passenger rail improvements.

Friday, December 21, 2007

Regional Traffic Congestion--Still Getting Worse

The Puget Sound region’s economy and population have continued to grow--and along with them, traffic delays--according to the Washington State Department of Transportation's Annual Congestion Report. Released yesterday, the report provides detailed analysis of the 38 most congested highway routes in the region, and (not surprisingly) it shows that commuters are traveling at slightly slower speeds and spending longer periods of time in traffic.

From 2004 to 2006, the Puget Sound region added 91,000 new jobs and 107,000 new residents; consequently, more people had to travel on the same roads at the same time. Overall, average travel times increased on 32 routes, decreased on three routes and remained constant on three routes. Travel time increased from one to seven minutes over the two-year period.

To effectively address growing congestion across the region, WSDOT will continue to emphasize key congestion management objectives--"maximizing system throughput and enhancing reliability"--through sustained focus on three strategies:
  • Managing demand (i.e., building HOV lanes, supporting Commute Trip Reduction efforts, and using technology to offer more real-time information);
  • Operating efficiently (i.e., installing ramp meters, synchronizing traffic signals, and deploying incident response units);
  • Adding capacity (i.e., completing capital projects).

Friday, November 17, 2006

It's Official--Regional Congestion is Growing

Submitted by Paul Ellis

The Washington State Department of Transportation's annual congestion report was released on Wednesday, and it shows that traffic congestion in the Puget Sound region is worse today than it was two years ago. On 34 of the 35 commute routes analyzed in the report, travel times have increased at peak periods, speeds have slowed, peak volumes have lengthened, and the reliability of travel times has grown worse--which means the system is less successful in moving people and freight.

Evening commute delays are getting worse than morning commute delays, possibly because there is more non-commuting traffic during afternoon hours. The data shows that I-5 Corridor commuters between Federal Way and Everett continue to experience the longest peak-period congestion.

Paul Ellis is lead staff for RAMP; an employee of the Tacoma-Pierce County Chamber, Ellis led the Pierce County Transportation Advisory Committee (PCTAC), the community's largest transportation planning effort.

Monday, October 16, 2006

Commute Times, They Are A'Changing!

Submitted by Paul Ellis

Commuting trends are changing as baby boomers near retirement age at the same time that a large immigrant population has swelled the national labor force, according to a report just released by the Transportation Research Board. In the report, Commuting in America III, Virginia transportation expert Alan Pisarski examined U.S. Census data from 1990-2004 and compared data there to reports he filed in 1987 and 1996.

Among the report's findings:
  • Commutes are getting longer--the number of workers who reach their jobs in less than 20 minutes dropped to 47% in 2000 after hovering around 50% for decades, and commutes in 40 states increased by two to four minutes;
  • The number of older female drivers will increase dramatically as baby boomers work past age 65--as the percentage of the population over 65 rises sharply after 2010, a key question will be how many will continue to work and commute;
  • The percentage of Americans who walk to work dropped from 5.6% in 1980 to 3.9% in 1990 and 2.9% in 2000;
  • More than 4 million Americans now work from home--more now than those who walk to work--and a growing number of workers over age 55 are doing so;
  • Although immigrants make up less than 14 percent of all workers, they represent about 40 percent of those in large carpools;
  • Hispanics carpool at a rate double that for non-Hispanics (23% vs. 11%), and there has been a sharp drop in the percentage of African-American households without vehicles (from 31% in 1990 to about 24% in 2000);
  • Although commuting still dominates public discussion about transportation, it represents just a part of the demand Americans make on the system--work travel now only constitutes 16% of all trips.
Factsheets on the study's information and meaning are also available.

Paul Ellis is lead staff for RAMP; an employee of the Tacoma-Pierce County Chamber, Ellis led the Pierce County Transportation Advisory Committee (PCTAC), the community’s largest transportation planning effort.

Thursday, August 31, 2006

San Diego's High-Tech Dashboard

Submitted by Paul Ellis

Those of us who follow transportation agencies like Sound Transit and WSDOT during the past few years have seen a remarkable enhancement in their financial transparency and efficiency with the public's dollars. In San Diego, state and regional agencies are taking that accountability one step further, making it real-time.

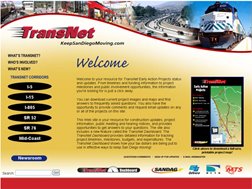
The San Diego Association of Governments (SANDAG) and Caltrans have launched the innovative, interactive TransNet Dashboard, an online reporting tool intended to provide the public with up-to-date information on transportation projects underway in the San Diego region that are funded by the TransNet half-cent sales tax. The state-of-the-art site is a Web-based connection to current schedule, budget, and expenditure information for highly anticipated projects underway on the I-5, I-15, I-805, SR 52, SR 76, and Mid-Coast corridors. The backbone of the site is programming that merges construction, finance, and schedule data from SANDAG and Caltrans databases for easier access.

Paul Ellis is lead staff for RAMP; an employee of the Tacoma-Pierce County Chamber, Ellis led the Pierce County Transportation Advisory Committee (PCTAC), the community’s largest transportation planning effort.